Australia is entering the second half of 2026 with El Niño conditions already established and forecasts pointing to further strengthening later in the year. NOAA gives a high chance of a very strong El Niño by October–December, and some media outlets have already started using the word “super.” At the same time, the Bureau of Meteorology’s latest outlook indicates an increased chance of below-average rainfall across parts of south-west, south-east, eastern, and southern Queensland during August–October. Murray–Darling Basin storage is also sitting near half capacity, a reminder that water availability depends not only on the strength of the Pacific signal, but on how rainfall actually unfolds over the coming months.
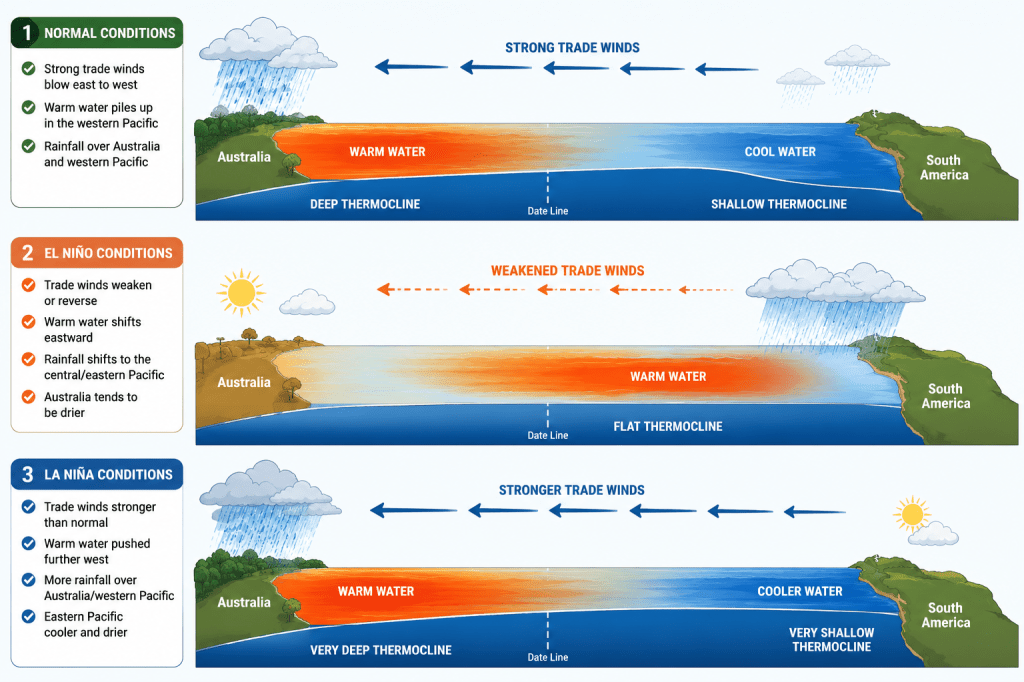
How El Niño shifts warm water, trade winds, and rainfall across the Pacific. Figure by the author.
What makes an El Niño “strong”
El Niño is classified by how much sea surface temperatures in the tropical Pacific rise above average, mainly in the Niño 3.4 region. The Oceanic Niño Index (ONI) tracks these anomalies, and a “strong” or “very strong” event means they are large and persistent. Current forecasts suggest this year’s event sits in that upper category.
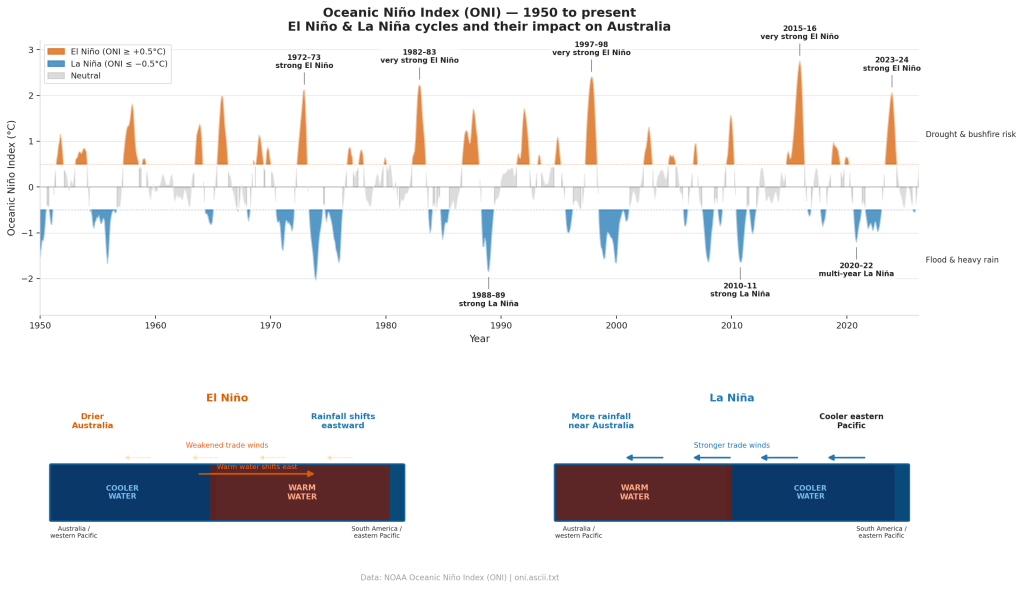
The Oceanic Niño Index since 1950, with major El Niño events annotated. Figure created by the author using NOAA ONI data.
The plot above shows where past events sit on this scale — 1997–98 and 2015–16 are the benchmark “very strong” events. Notice something, though: those peaks are similar in height, yet their impacts on Australian rainfall were not identical. That difference is the real story.
This year’s El Niño has not yet peaked like the historic 1997–98 or 2015–16 events, but forecasts indicate it could move into very strong territory later in 2026. That makes it worth watching closely, while still remembering that forecast strength and local rainfall impact are not the same thing.
Why “strong” doesn’t mean “certain”
Here’s the part that’s easy to miss in headlines: the strength of the Pacific signal and the strength of its impact on the ground in Australia are two different things. A moderate El Niño has, in the past, produced serious regional drought, while a stronger event elsewhere has left some regions relatively unaffected. Rainfall outcomes depend on how that global-scale ocean signal interacts with regional weather systems, other drivers like the Indian Ocean Dipole, and local land–atmosphere feedbacks — none of which are captured by a single Pacific index.
What to actually watch, rather than the label
Instead of treating “super El Niño” as a forecast in itself, it’s more useful to track:
- Regional rainfall outlooks, updated monthly, which reflect the latest observed conditions rather than just the Pacific signal
- Water storage levels in the basins that matter to you — the Murray–Darling sits near 51% as of early July, a useful marker of how much buffer remains if dry conditions continue
- Compounding drivers, such as a developing Indian Ocean Dipole, which can amplify or offset the ENSO signal depending on the season
This season, I am watching whether the strengthening Pacific signal translates into sustained rainfall deficits, declining soil moisture, reduced inflows, and elevated fire weather risk across eastern and northern Australia.
The bottom line
A strong El Niño raises the odds of a drier, hotter second half of 2026 for large parts of Australia — but it is a shift in probability, not a guarantee. The most useful response is preparation based on current, regularly updated conditions rather than the label itself.
The ONI figure in this post comes from a Python workflow I shared previously — if you’d like the full code and data walkthrough for tracking ENSO yourself, subscribe below.


Wildfires in Victoria and LA: Climate Crisis Exposed
Recent wildfire events in Victoria, Australia, and Los Angeles, USA, have highlighted the intensifying frequency and ferocity of fires in a warming world. These incidents serve as stark reminders of the urgent need for global climate action to mitigate the cascading effects of rising temperatures on ecosystems, communities, and economies. Victoria’s Bushfires: A Nation Scorched…

Global Climate Models: Our Window to Future Climates
Global Climate Models (GCMs) are sophisticated tools designed to simulate the Earth’s climate systems and predict future changes. These models integrate complex interactions between the atmosphere, oceans, land surface, and ice to project how variables such as greenhouse gas concentrations will influence global climates. Their predictions, crucial for climate policy and adaptation strategies, hinge on…
Global Tipping Points: Navigating Earth’s Critical Thresholds
Our planet’s equilibrium is delicate, a balance that, once disrupted, can lead to global tipping points—critical thresholds that, when crossed, result in significant, often irreversible changes. These tipping points are not confined to environmental issues alone but span across ecosystems, economies, and societal structures. Understanding, identifying, and navigating these thresholds is crucial for sustaining life…


Leave a Reply